
Standard Operating Procedures - Arid lands vegetation monitoring
KEY DETAILS
- Principal Investigator
- Dr. Lucy Smyth
Date - 8 April 2025
Version - 1.0.2
Programme - Arid Biodiversity Programme
Key partners - ORKCA Contact email
- lsmyth@naturalstate.org
1. PREAMBLE
Natural State’s research methods and activities are detailed by a set of accepted Standard Operating Procedures (SOPs). These documents describe the steps involved in all Natural State research methodologies, from data collection to data processing and storage. Each SOP documents key methodological details for a specific data type. The objectives and background of the projects or surveys these methods are used for, features of the study area where these methods are applied, and details on survey and sampling designs for these methods may be found in survey Design Documents (DDs), which are available in the Related Documents section below or may be perused in the main NS Design Documents documentation page.
2. GLOSSARY
3. METHODS OVERVIEW
The arid lands vegetation monitoring protocol is used to monitor plant species presence and abundance across the landscape so that spatial and temporal changes in vegetation can be documented. Monitoring vegetation diversity and cover in plots across the landscape provides data on the number of species present as well as their dominance in the landscape. This protocol involves the use of nested subplots, which yields data at multiple scales, allowing for heterogeneity within the landscape to be documented.
3.1 METHOD AIMS
The arid lands vegetation monitoring methods are designed to:
- Document tree species richness across the landscape.
- Document shrub, grass and forb species richness in nested quadrats.
- Document the percentage cover of the most dominant plant species.
3.2 METHODOLOGICAL BACKGROUND
These methods for monitoring vegetation have been adapted from the NEON Plant diversity sampling protocol. The methodology requires the establishment 40 m X 40 m plots, each containing 8 1m X 1m quadrats. Tree, shrub, grass and forb species presence and percentage cover is then recorded in a series of nested quadrats to look at vegetation diversity at multiple scales. This methodology has been developed in a way that will allow it to be linked to aerial data from drones, planes or satellites in the future.
4. SAMPLING PREPARATION
The equipment mentioned in the list below needs to be gathered, checked and packed before sampling begins. If any sensors need to be configured prior to commencing sampling this will be documented below the equipment list.
4.1 EQUIPMENT LIST
- 6 X 50 m measuring tapes
- 1 m X 1 m metal quadrat
- 3.16 m X 3.16 m quadrat constructed from rope tied around metal droppers at the appropriate points (allows for easy transportation)
- 2 m long measuring stick
- flexible measuring tape
- handheld GPS
- tablet with S123 loaded and a functional camera
4.2 DEVICE CONFIGURATION
- The S123 app needs to be loaded onto the tablet and the ABP Vegetation Survey needs to be loaded.
- Station locations need to be loaded onto the handheld GPS.
5. SAMPLING PROCEDURES
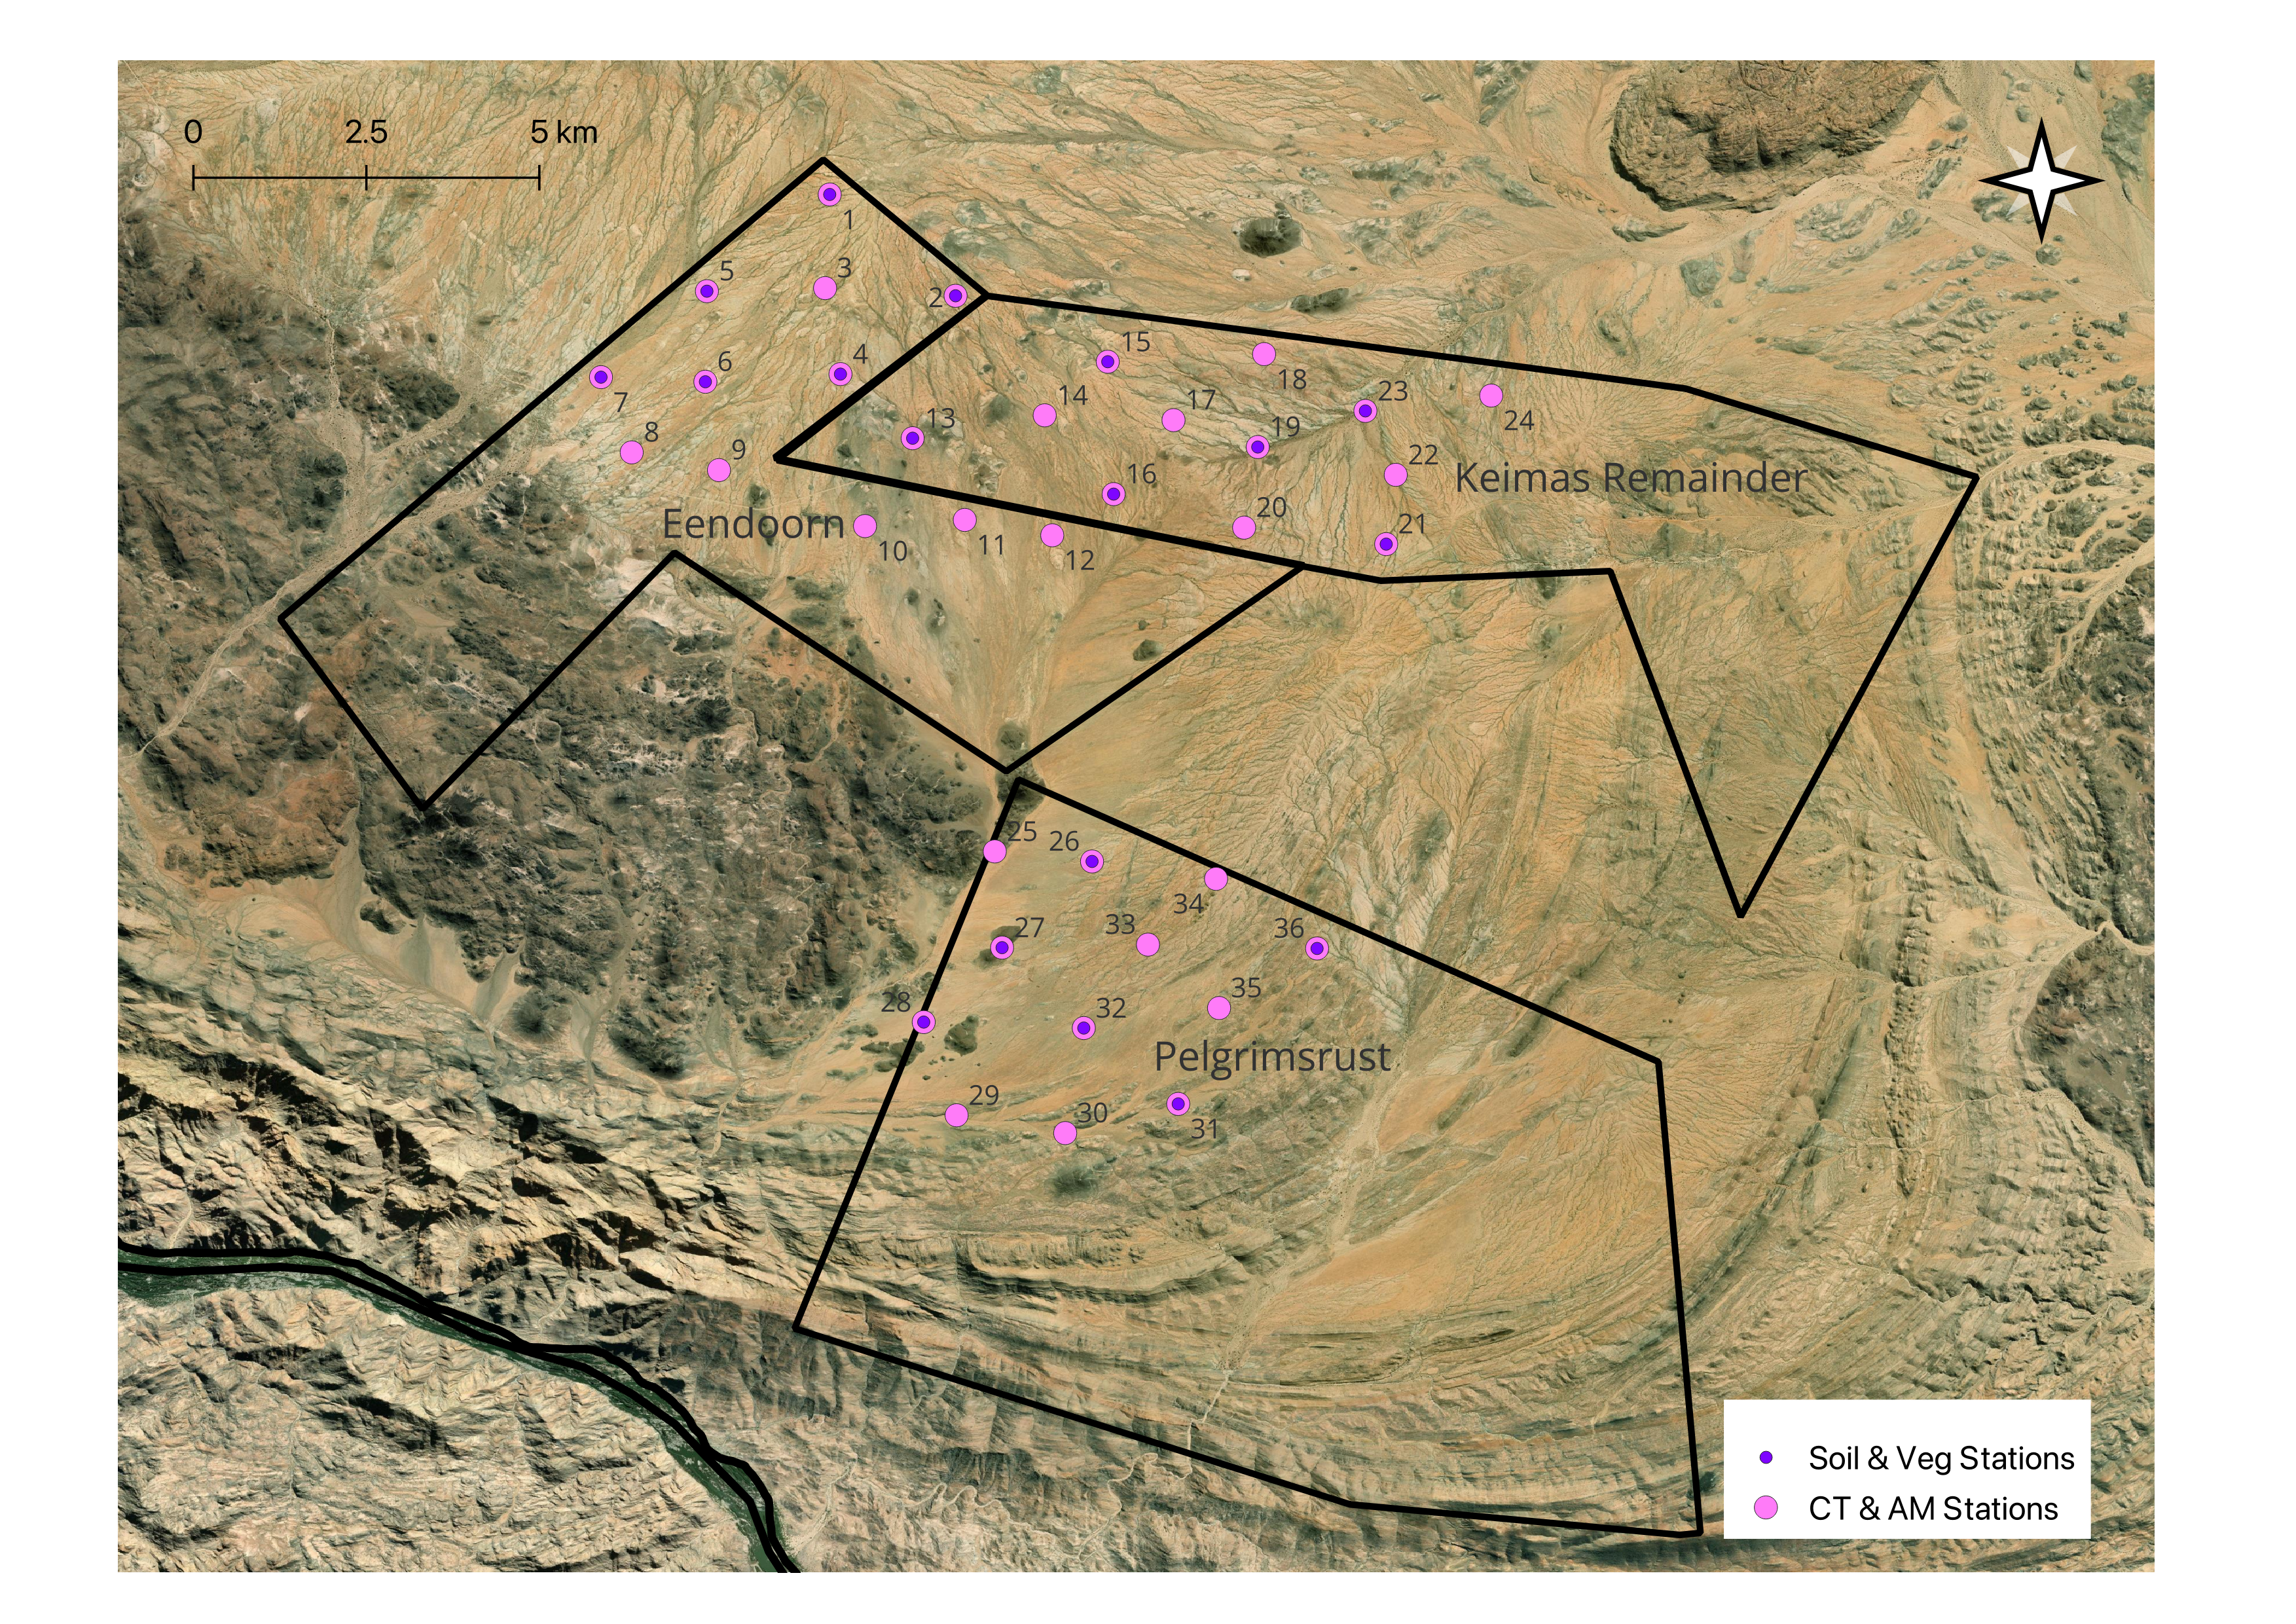
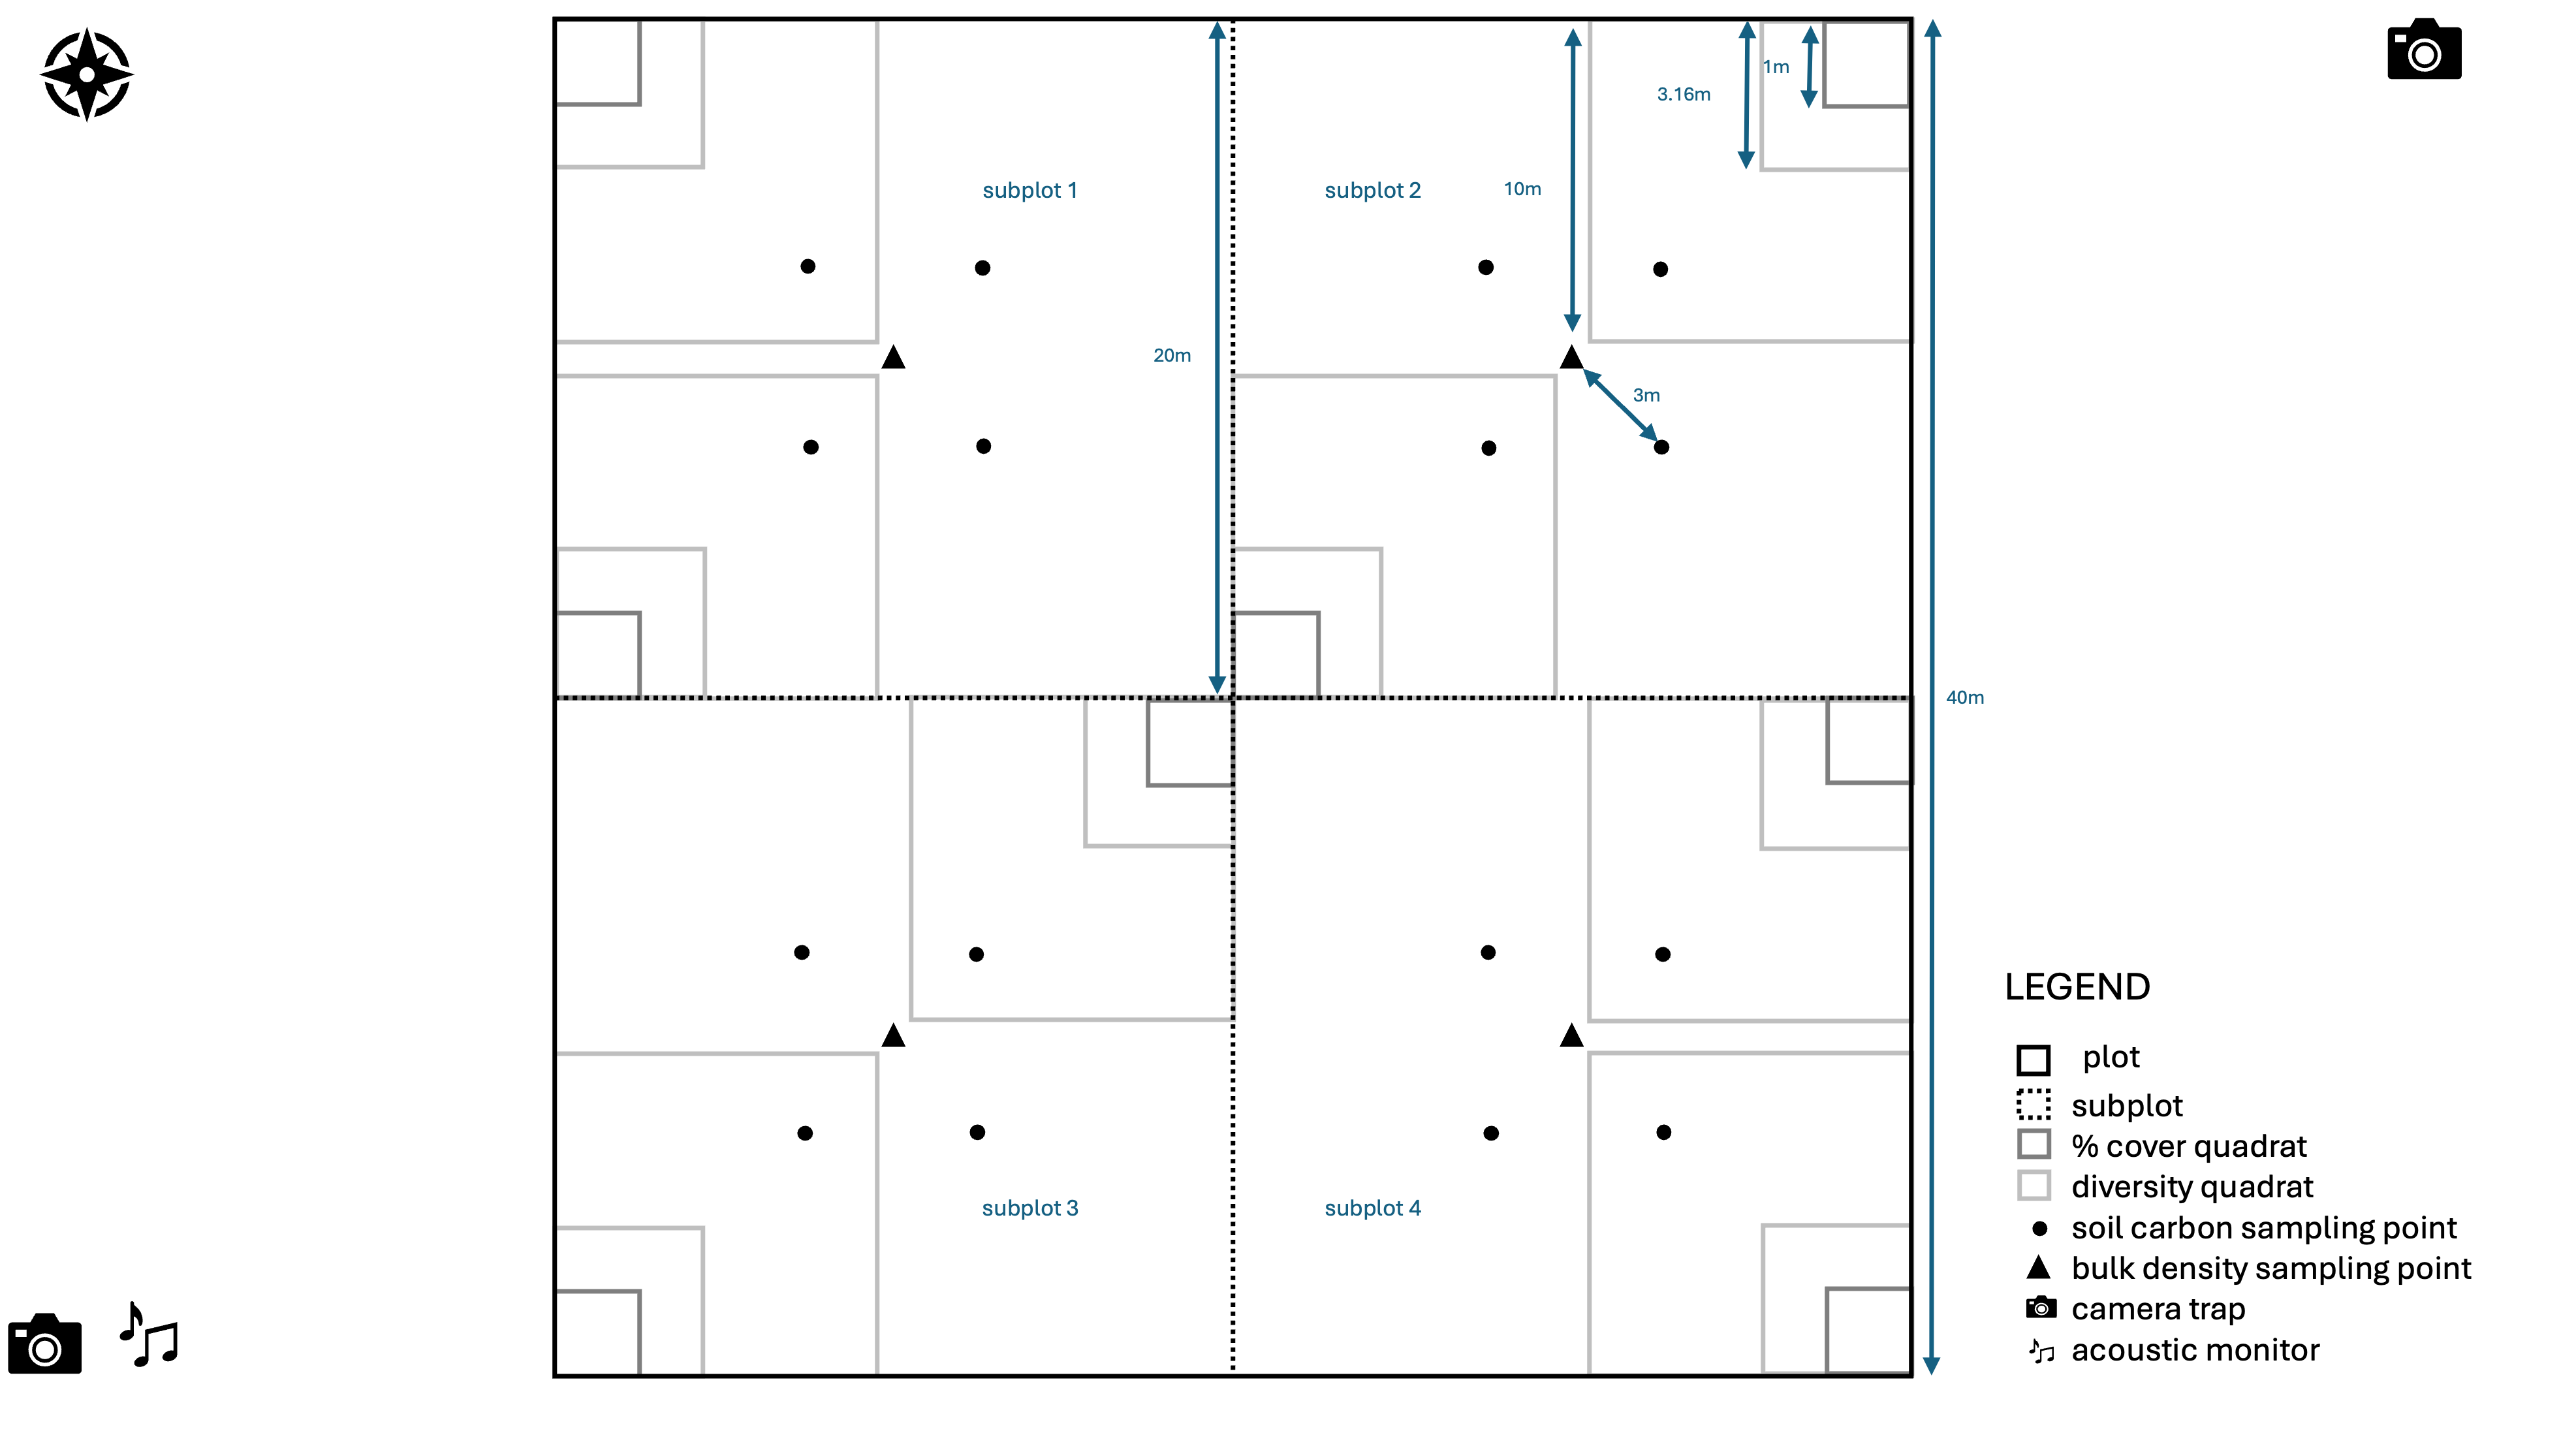
These methods for monitoring vegetation in arid lands require establishing 40 m X 40 m plots, each containing eight 1 m X 1 m quadrats. Each of these quadrats is nested within a larger quadrats of 10 m², allowing us to account for heterogeneity at different scales. All trees in each subplot should be recorded to species level and the circumference of their basal area should be measured. All shrubs, grasses and forbs should be recorded to species level in each 1 m² quadrat. Additionally, the aerial percentage cover of the three most dominant vegetation species in each 1 m² quadrat should be recorded, as well as the percentage cover of bare ground. Any additional shrub, grass and forb species not present in the 1 m² quadrat but present in the 10 m² quadrat should be recorded. Six plots will be sampled per property, paired to existing sampling sites from the camera trap and acoustic survey. These plots will be the same for the soil carbon survey.
5.1 ORKCA PILOT STUDY
- Navigate to the sampling location. This should be at the midpoint of the two camera traps deployed during the Arid Biocredit Pilot.
- Establish the extent of the 40 m X 40 m plot by running a 50 m measuring tape 20 m north and 20 m south and by running a second one 20 m east and 20 m west, intersecting at the sampling location.
- Use another four 50 m measuring tapes to demarcate the 40 m edges of the plot.
- Open the S123 App and collect the metadata required by the Arid Vegetation Survey.
- Start in subplot 1. Stand in the centroid of the plot and take a photograph of subplot 1 in the S123 form.
- Record whether any trees are present. If any trees are present, record all individual trees within the plot by species, and measure the circumference of their trunk (basal area) at the point where it enters the ground. Trees should be recorded as present within the plot if any portion of their basal area falls within the plot. Do not record them as present if their entire basal area falls outside the plot.
- Place the 1 m X 1 m metal quadrat in location 1, as indicated in the figure above (northwest corner of the plot), and record a lists of all shrub, grass and forb species present within the quadrat. Similarly to trees, a species should only be recorded as present if any portion of its roots enter the ground within the quadrat. If a species cannot be identified it should be recorded with a more general name, such a ‘species_1’ in S123, and a sample should be taken and identified back at the office with the help of a book or expert. A list of how more general names map to species names must the be provided to the project PI.
- Record the percentage (to the nearest 1%) of the quadrat that is bare ground from above (not shaded by any vegetation growing directly above it, excluding tree canopy > 1 m high).
- Identify the three most dominant species in the quadrat and record each of their percentage aerial cover (to the nearest 1%). The total percentage cover of bare ground and the five most dominant vegetation species cannot exceed 100%, but can be less than 100% if there are other species present in addition the the five most dominant species that take up over 1% of the space.
- Hold the tablet at a heigh of X m in the center of the northern edge of the quadrat and take a photograph with the camera facing directly downwards. The field of view should include the entire 1 m² quadrat.
- Place the 3.16 m X 3.16 m quadrat around the 1 m X 1 m quadrat as shown in the figure below and record any additional species that were not accounted for in the smaller quadrat. Do not record percent cover in this quadrat.
- Move the two nested quadrats to the second quadrat location in subplot 1, as show in the figure above, and follow steps 7-11. There are 2 quadrat locations per subplot.
- Move to subplot 2, then 3, then 4, repeating steps 5-12 in each subplot.
- Pack up equipment and move to the next plot.
6. POST PROCESSING
Any plant species recorded at plots that did not previously exist in the species list should be sent to the project PI to be added to the choices list in S123.
6.1 SAMPLE PROCESSING AND STORAGE
This protocol does not involve any sample collection.
6.2 DATA ENTRY AND UPLOADS
S123 forms need to be sent to the cloud upon return to internet or cell phone reception.
7. RELATED DOCUMENTS
7.1 DESIGN DOCUMENTS
7.2 OTHER RELEVANT SOPS
7.3 DATA ELEMENTS
Survey Design
Data Collection
Dashboard
8. REVISION AND VERSION HISTORY AND DESCRIPTION
v1.0.0 Initial SOP created in March 2025. v1.0.1 Updates following field visit, incuding selection of the six sites per property and a slight simplification of the initial methodology in terms of reducing number of percentage cover estimates and removing the 100 m² quadrat. v1.0.2 Updates to the figure of sampling layout.